Nowadays, it has become almost inconceivable to imagine agriculture without sensors, whether they are simple GPS devices to help farmers optimize their work in the fields, monitor livestock, or more complex equipment allowing advanced monitoring of animals (e.g. animal welfare detection) or farm machinery. In particular, in the horizon of precision farming (or smart farming), smart sensors generate (geo-referenced) data, that make it possible to support the farmer with optimization, decision support, or prediction by means of Artificial Intelligence. For example field operations like fertilization, seeding, or harvesting can be optimized. A well-known challenge in smart farming is to reduce the energy consumption of the sensors without losing data quality. Another one is the latency of the connected sensors, which may cause problems when the generated data is used for further analysis.
A multitude of data is produced and analyzed by specialized software or is available in their raw form to farmers. However, the results of this kind of analysis must be used with caution – indeed, the adage „garbage-in, garbage-out“ is too often neglected. The wrong unit, the wrong calibration of a sensor or the use of the wrong geo-reference are „simple“ errors which – if detected too late– can influence the outcome of the analysis and might result in serious consequences.
In general, data quality assessment needs to tackle the following obstacles:
- What standards or norms should be used?
- What can be measured or analyzed? Which problems should be detected and highlighted, which problems are of little importance or can be ignored?
- What happens after the problems are detected? How to communicate and display the detected problems and to whom?
A clear definition of data quality and its impact in the context of agriculture – especially in the field of smart farming – is hard to find. Thus, we aim to answer the three questions above by working closely with different partners and domain experts. In the European Horizon 2020 project DEMETER, we deeply investigated the topic of data quality and developed a tool to detect potential data quality problems in structured and semi-structured files.
Data quality problems
In general, the quality of sensor data must be ensured to get proper decision support systems that can help farmers to improve their businesses. We focus on the data itself, e.g. data quality problems such as corrupted, missing, invalid, incredible, noisy, inconsistent or unreliable data. Besides, other mistakes such as outliers, anomalies or are issues caused by data that is not up to date or by sensors that are stuck at zero, can occur. Various problems – not only technical ones – can arise during field operations: it can be a sensor deficiency, the lack of GPS connection or sometimes an error made by the farmer because some values (e. g. the brand name of a chemical) must be added manually into the appropriate systems. Such errors have to be detected automatically so that a decision can be made about whether the data is proper to be used for further analysis or whether it should be handled at first. Otherwise, erroneous data in a decision support system can result in misleading outcomes.
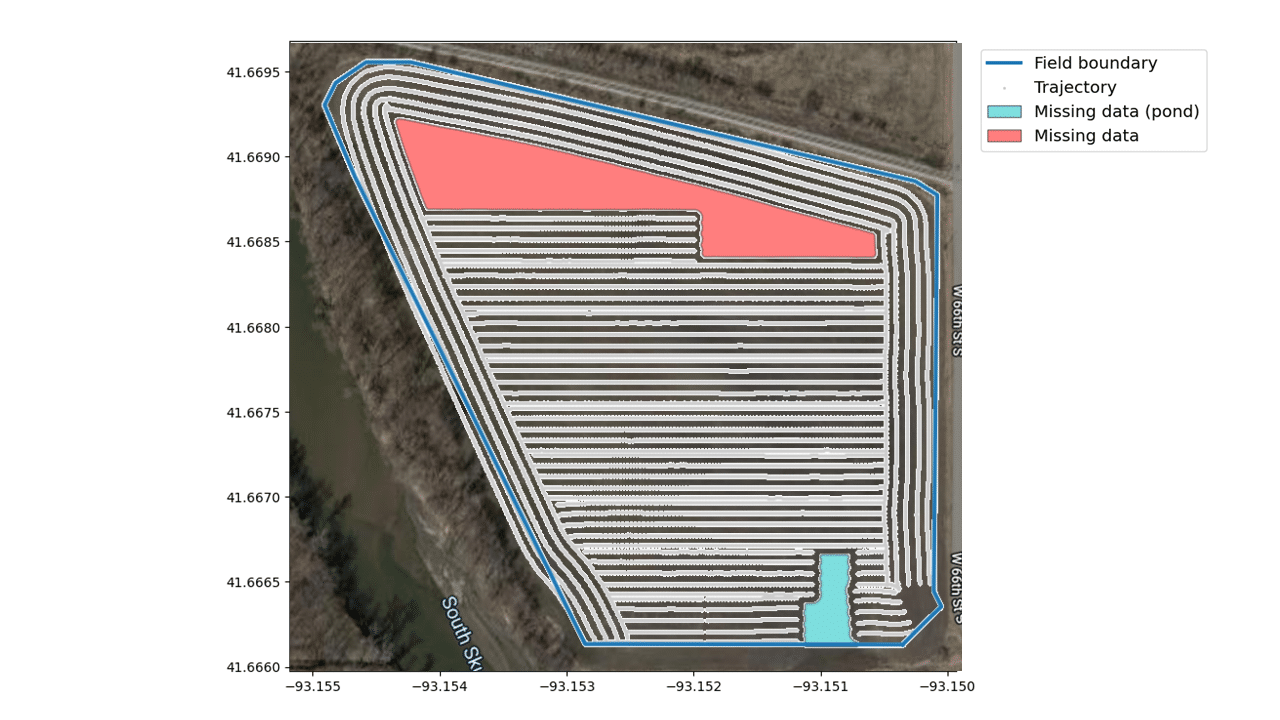
In literature, there are several approaches to classify and categorize data quality problems. Errors can be of different natures, thus they are not necessarily critical or even problematic. For instance, let’s take missing values: when no fertilizer is being applied or when the machine is outside the field boundaries (e.g. when the driver is turning), the machine will record the GPS coordinates but the sensor for fertilizer application will return default values. Therefore, it is no surprise that many zero-values or even many missing values arise. Another question is whether there are only operational interests (for optimization) or whether certain regulations (evidence for administrative controls) must be respected. In the latter case where a running machine must meet regulations the completeness of the records plays a far more important role. The picture below shows a typical example of a file that contains undesired recordings related to missing values.
Requirements on Data Quality Assessment
During our studies, our DEMETER project team conducted expert interviews with technology providers in the agricultural domain. In the following we publish an extract from points that were mentioned to be important:
- The results of an assessment should be provided in a machine-readable format, e.g. JSON or CSV, to enable an automated processing. For such processes a word file would be difficult to handle even though it might be more understandable for the user.
- Each data quality measurement function should be scored in a manner so that 100% represent good data quality and 0% represent a poor data quality. Often such functions are ratios, i.e. the relative proportion of measurement points that are considered valid. Many measurements are Boolean values that can also be represented by true=100% and false=0% (for example, a verification that the actual crs geo-reference standard of the file matches the expected standard). Note, that a result of 0% is not necessarily bad, just as a result of 90% can be highly critical. For example, if the GPS points are outside the boundaries of a field but applied nitrogen values are null (0.0), this has no bigger consequences as no fertilizer was actually spread.
- The data quality assessment tool should be configurable to meet the individual needs of users. In most cases, the user wants to be able to adjust values such as the valid ranges or the desired data resolution.
- For numerical values, an overview of the statistics (e. g. mean, median, quantiles, …) must be delivered right away. Often, corrupted data can be detected just by looking at the corresponding mean values. Also, very high standard deviations indicate outliers which are usually not desirable.
- Visualizations (for example histograms or trajectories) are mandatory. From an engineering perspective, it is absolutely necessary to understand the reason why the data quality is poor. Visualizations can help to get a deeper insight into the cause of bad data quality.
The IESE solution for Data Quality Assessment
Based on the interview results, we at Fraunhofer IESE implemented a data quality assessment tool. This tool gives users a better understanding of their data situation, helping them to identify and quantify potential data issues.
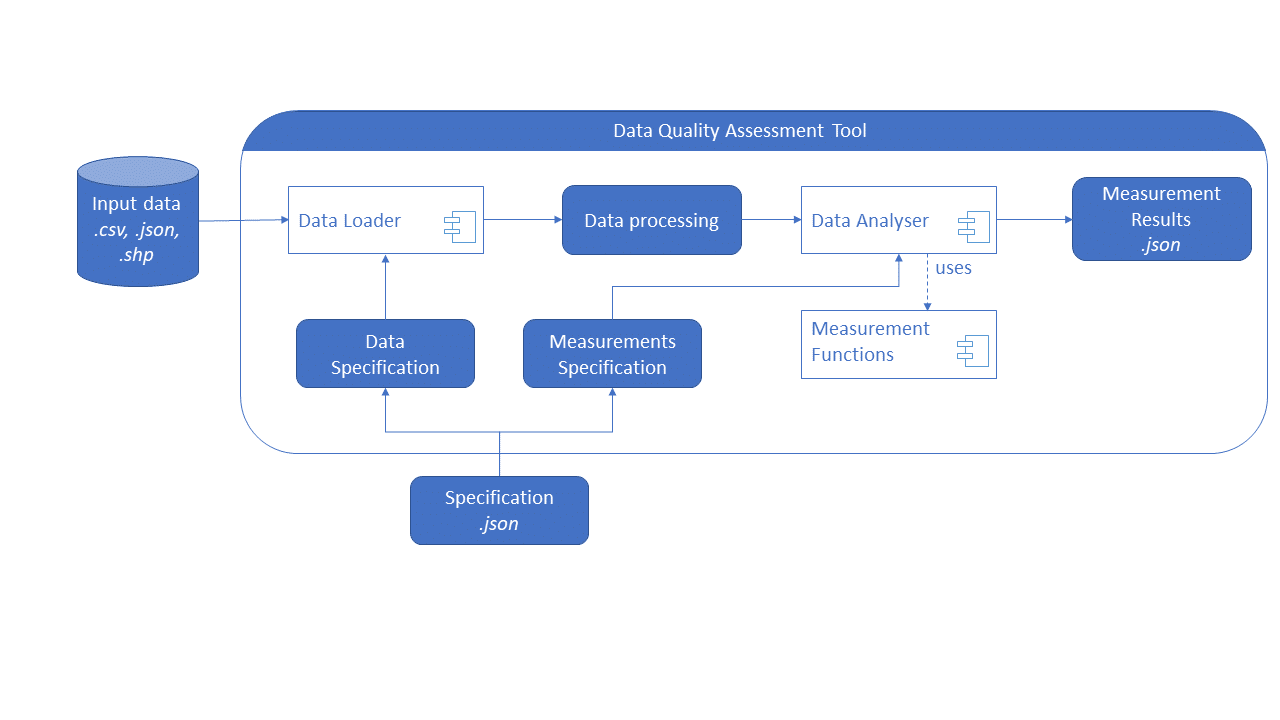
The IESE quality assessment tool was developed in Python. In terms of input, i.e., regarding the data on which the data quality is assessed, it can handle data in CSV format and shapefiles. The user can configure the tool by specifying several parameters in a JSON file. This configuration can be modified in any text editor and the end-user does not need any specific programming knowledge. Our data quality assessment tool is a REST API that returns the results in JSON format, which is machine-readable. So far, 17 metrics have been implemented to assess the quality of structured data. For each metric, the percentage of occurrence of problematic values is determined. In addition, a detailed list of suspicious data can be generated. We released the tool under the open-source Apache 2 License. It has been dockerized and can run on-premise or be accessed remotely. The tool helps users understand potential data problems and enables them to initiate improvements, e.g., regarding the data collection or the follow-up data analysis. This can enable practitioners to develop more valuable smart farming services.
You want to learn more?
Data quality is a key aspect of quality assurance for AI in safety-critical systems. To learn more about the state of the art and challenges, attend our 4-day Certified »Data Scientist Specialized in Assuring Safety« seminar.
You are also interested in working on projects involving data quality assessment? – Contact our expert Anna Maria Vollmer.